Wi-Fi spectrum
The Wi-Fi spectrum page charts the networks around you by channel and signal strength, so you can see which channels are crowded and which networks overlap.
Opening it
Section titled “Opening it”- From Signals > Wi-Fi: tap the chart button at the end of the Flat · BSSID / Group by SSID row. In a short window, such as a phone in landscape, the button sits on the line at the top instead. The charts start from the list’s last scan.
- From More > Tools > Wi-Fi spectrum. The charts fill in with the next scan.
Like the Wi-Fi list, the page needs precise location, location turned on, and Wi-Fi or Wi-Fi scanning on. If something is in the way, a notice at the top says what and how to fix it. The page scans for as long as it is open, with or without a survey.
What you see
Section titled “What you see”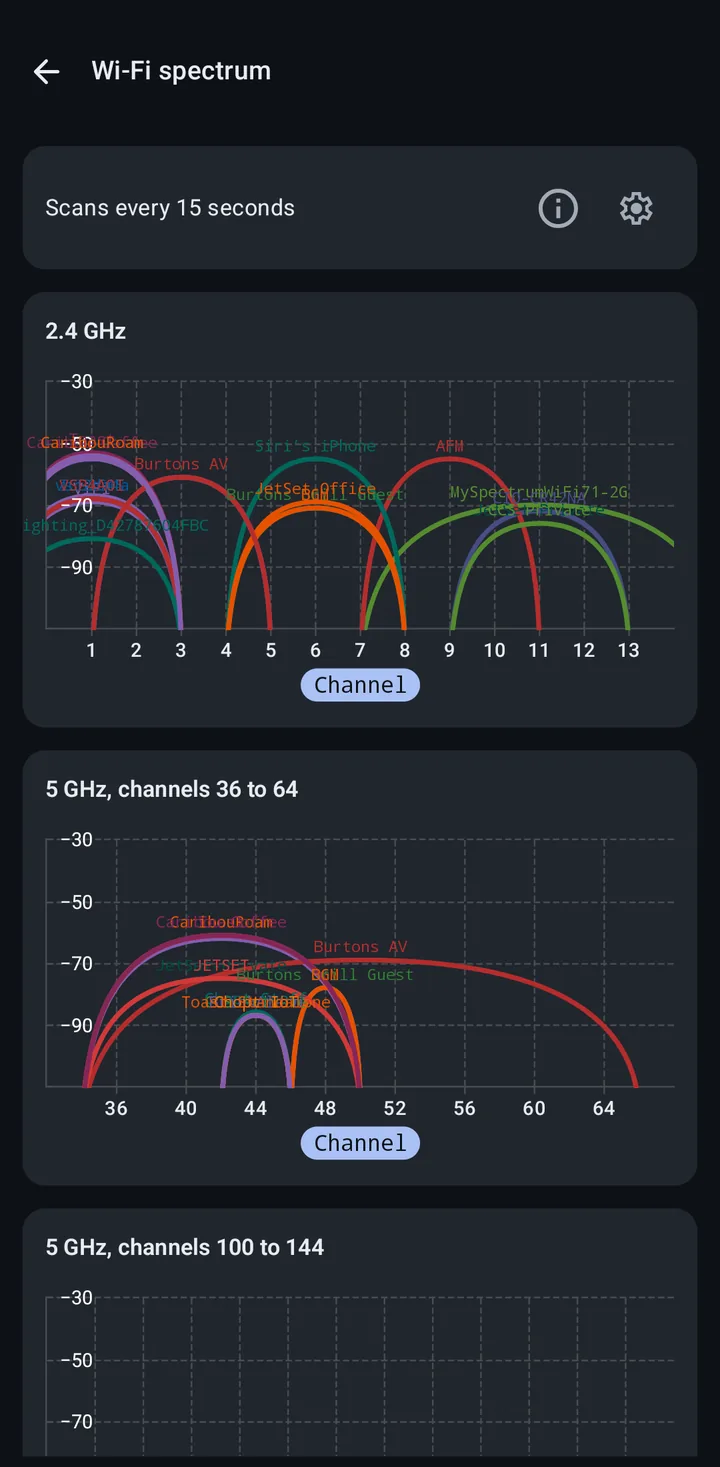
The top of the page says how often it scans, with an info button that explains the scan rate and a settings button. Below it are five charts:
- 2.4 GHz
- 5 GHz, channels 36 to 64
- 5 GHz, channels 100 to 144
- 5 GHz, channels 149 to 177
- 6 GHz
Each network is an arc centered on its channel, as wide as its channel width and as tall as its signal strength, labeled with its SSID. Each SSID keeps the same color from scan to scan, so you can follow it. Access points the phone listed without a signal measurement are left off.
Common uses
Section titled “Common uses”Site surveys:
- Find the least congested channels before deploying new access points
- On 2.4 GHz, channels 1, 6, and 11 do not overlap; on 5 and 6 GHz, pick a channel with little overlap
Troubleshooting interference:
- See channel congestion and overlapping networks
- Find clearer channels to improve performance
Network planning:
- See all the access points in a building
- Assign non-overlapping channels across multiple access points
Related
Section titled “Related”- Wi-Fi networks: the Wi-Fi list and details
- Scan rates: adjusting the Wi-Fi scan interval
- Wi-Fi SSID exclusion: leaving networks out of your data