Map settings
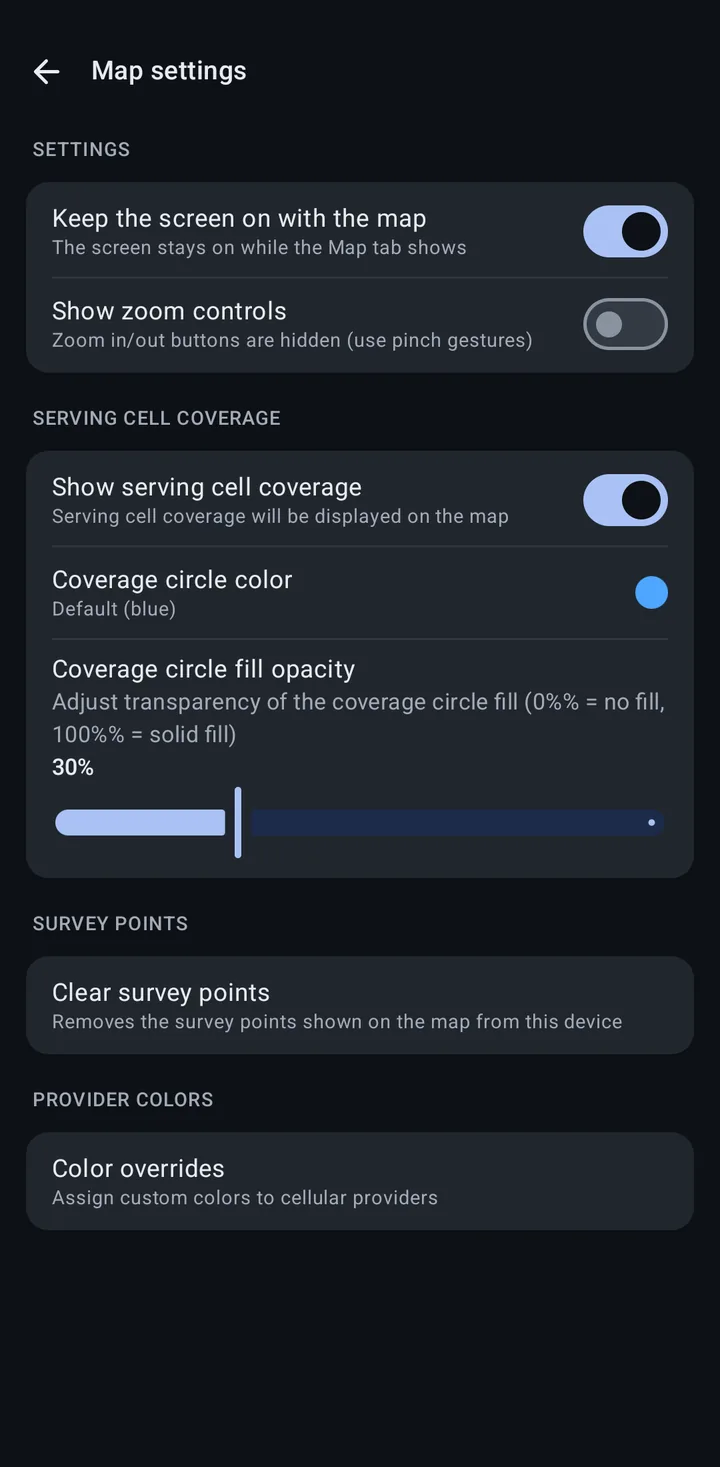
Map settings holds the display options for the Map tab. Open it in either of two ways:
- On the Map tab, tap the gear (Map settings) in the row of round buttons on the map.
- Go to Settings > Map and lookups > Map settings.
What the map shows (towers, the tower data source, BeaconDB coverage, filters such as the tower age) is chosen in the Map tab’s Layers and Filters sheets, not here. See Map tab.
Settings
Section titled “Settings”| Row | Default | What it does |
|---|---|---|
| Keep the screen on with the map | On | ”The screen stays on while the Map tab shows”. Off, the screen turns off normally after inactivity. |
| Show zoom controls | Off | Shows zoom in and zoom out buttons on the map. Off, you zoom with pinch gestures. |
This is separate from Keep the screen on while recording in Settings > Phone (on by default), which keeps the screen on anywhere in the app while a survey records.
Serving cell coverage
Section titled “Serving cell coverage”| Row | Default | What it does |
|---|---|---|
| Show serving cell coverage | On | Draws a circle on the map for the serving cell’s coverage. |
| Coverage circle color | Default (blue) | Default (blue), Red, Green, Orange, Purple, Yellow, Cyan, or White. |
| Coverage circle fill opacity | 30% | A slider from 0% (no fill) to 100% (solid fill). A lower value lets you see the map under the circle. |
The color and opacity rows only appear while Show serving cell coverage is on.
Survey points
Section titled “Survey points”Clear survey points “Removes the survey points shown on the map from this device”. The app asks “Clear survey points?” first, and Clear confirms. It does not affect data already sent to OpenCelliD, BeaconDB, or NS Analytics, and it does not delete your log files.
Provider colors
Section titled “Provider colors”Color overrides (“Assign custom colors to cellular providers”) opens a list where you give a provider, by MCC-MNC, its own color on the map. You can also set a provider’s color from a tower’s details sheet on the Map tab.