GNSS
Network Survey reads every satellite system the phone’s GNSS receiver reports: GPS, GLONASS, Galileo, BeiDou, QZSS, and IRNSS, plus SBAS augmentation satellites (WAAS, EGNOS, GAGAN, MSAS, SDCM, SNAS, SACCSA, and SouthPAN).
The full list of fields in a GNSS record is defined in the NS Messaging API documentation.
The GNSS view
Section titled “The GNSS view”Open Signals and pick GNSS. A toggle at the top switches between two pages, Status and Sky. Next to it are the sort button (Status only) and the filter button.
The view needs precise location and location turned on. It runs only while it is on screen: leaving the GNSS view, the Signals tab, or the app stops it. It does not need a survey, and it is separate from the GNSS records a survey saves, which follow the GNSS scan interval (45 seconds by default, see Scan rates).
Until the first fix, the view says it is looking for satellites. Outside or near a window, a first fix takes about a minute.
Status page
Section titled “Status page”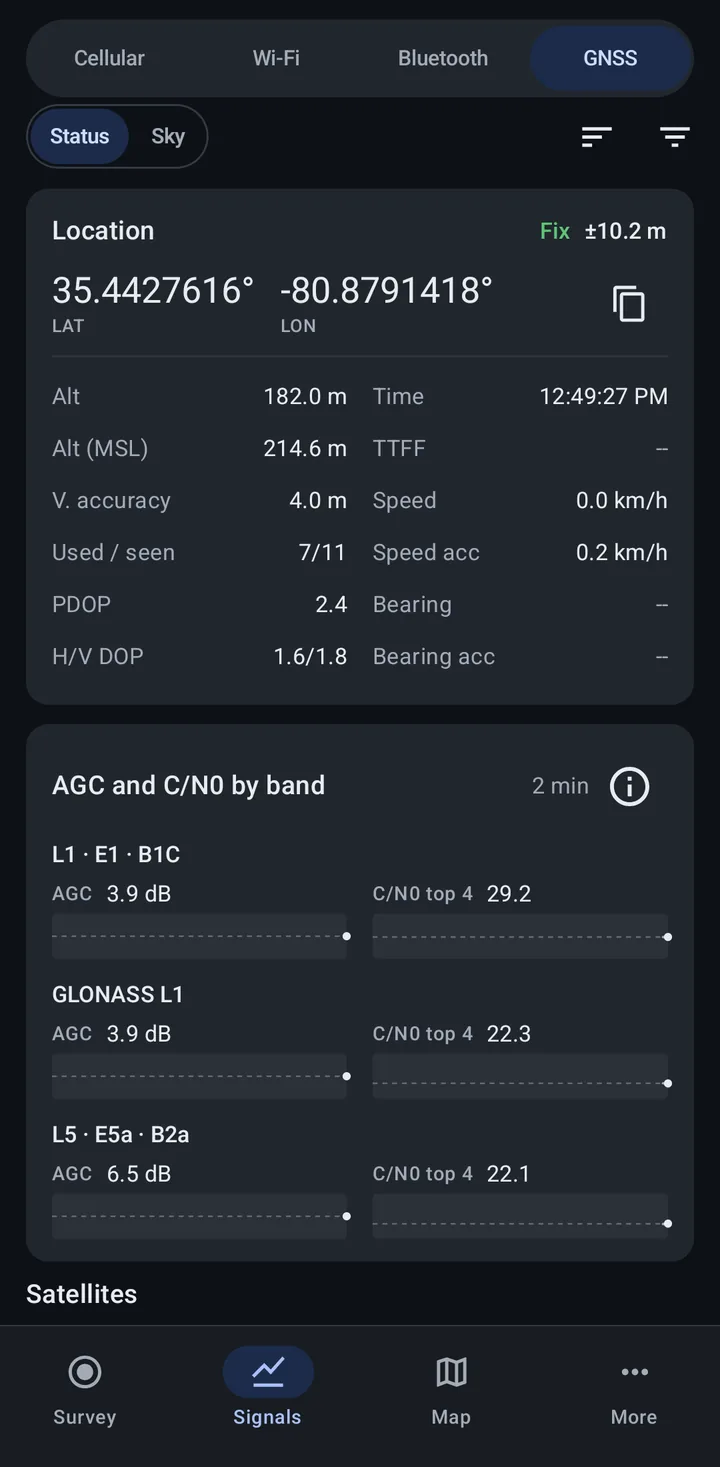
Location
Section titled “Location”The Location card shows the current fix:
- Fix with the horizontal accuracy (for example “±10.2 m”), or No fix. After the fix is lost, it shows when the last fix was.
- Latitude and longitude, with a button to Copy location
- Alt and Alt (MSL): altitude above the ellipsoid and above mean sea level
- V. accuracy: vertical accuracy
- Used / seen: satellites used in the fix out of those seen
- PDOP and H/V DOP: dilution of precision; lower means better satellite geometry
- Time and TTFF (time to first fix)
- Speed, Speed acc, Bearing, and Bearing acc
If the receiver’s time is days away from the phone’s clock, the card offers Why is the time wrong?, which explains the GPS week rollover issue.
AGC and C/N0 by band
Section titled “AGC and C/N0 by band”This panel groups the signals by band (for example “L1 · E1 · B1C” and “L5 · E5a · B2a”) and shows two lines for each over the last 2 minutes:
- AGC: how much the receiver amplifies that band, in dB. Some phones do not report it, and the panel then says “This phone does not report AGC.”
- C/N0 top 4: the average C/N0 of the band’s four strongest signals.
Each line has a dashed line at its 2 minute median, so a step stands out. The panel always covers every satellite system, even while the filter hides some.
Tap the info button for Reading AGC and C/N0. In short: extra power in a band, such as a jammer, makes its AGC drop, and anything else that adds power there can move it too. Buildings, vehicles, and your hand lower C/N0 on many satellites at once, usually with AGC steady. A drop in AGC together with a drop in C/N0 on one band but not another is worth a closer look, and so is C/N0 that is unusually high and nearly the same on every satellite. Levels differ between phones, so compare with your phone’s normal readings.
Satellites
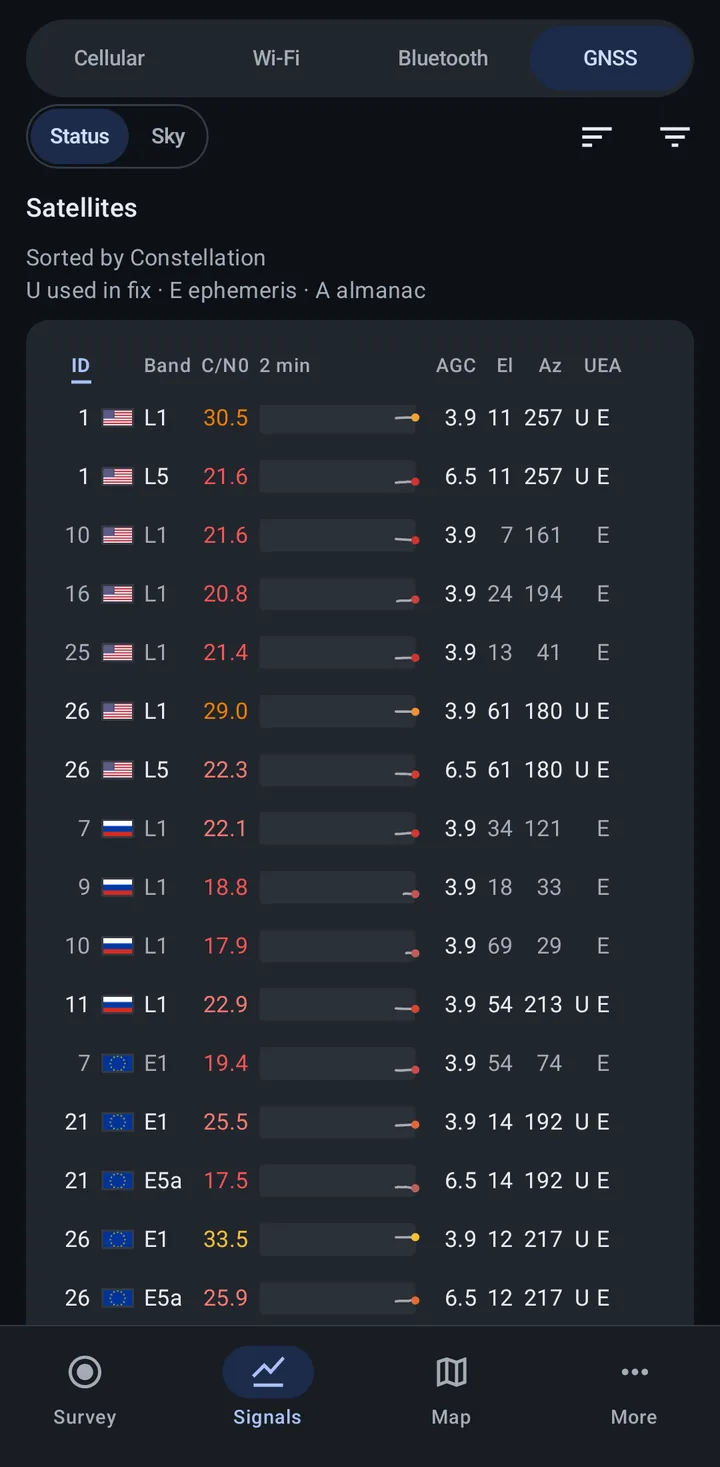
Section titled “Satellites”The Satellites table lists each signal, and a separate SBAS satellites table lists the augmentation satellites. The columns are:
- ID with the system’s flag
- Band
- C/N0 in dB-Hz, colored by strength, with a 2 minute trend
- AGC
- El and Az: elevation and azimuth in degrees
- Flags: U used in fix, E ephemeris, A almanac
The line above the table says how it is sorted. Use the sort button to sort by Constellation, Carrier frequency, Signal strength, Used in fix, the constellation combinations, or AGC, or tap a column header.
Filter
Section titled “Filter”The filter button opens Show only these GNSS, where you pick the systems to show on both pages. While it hides some, the page says how many signals it shows, with Show all to clear it.
Sky page
Section titled “Sky page”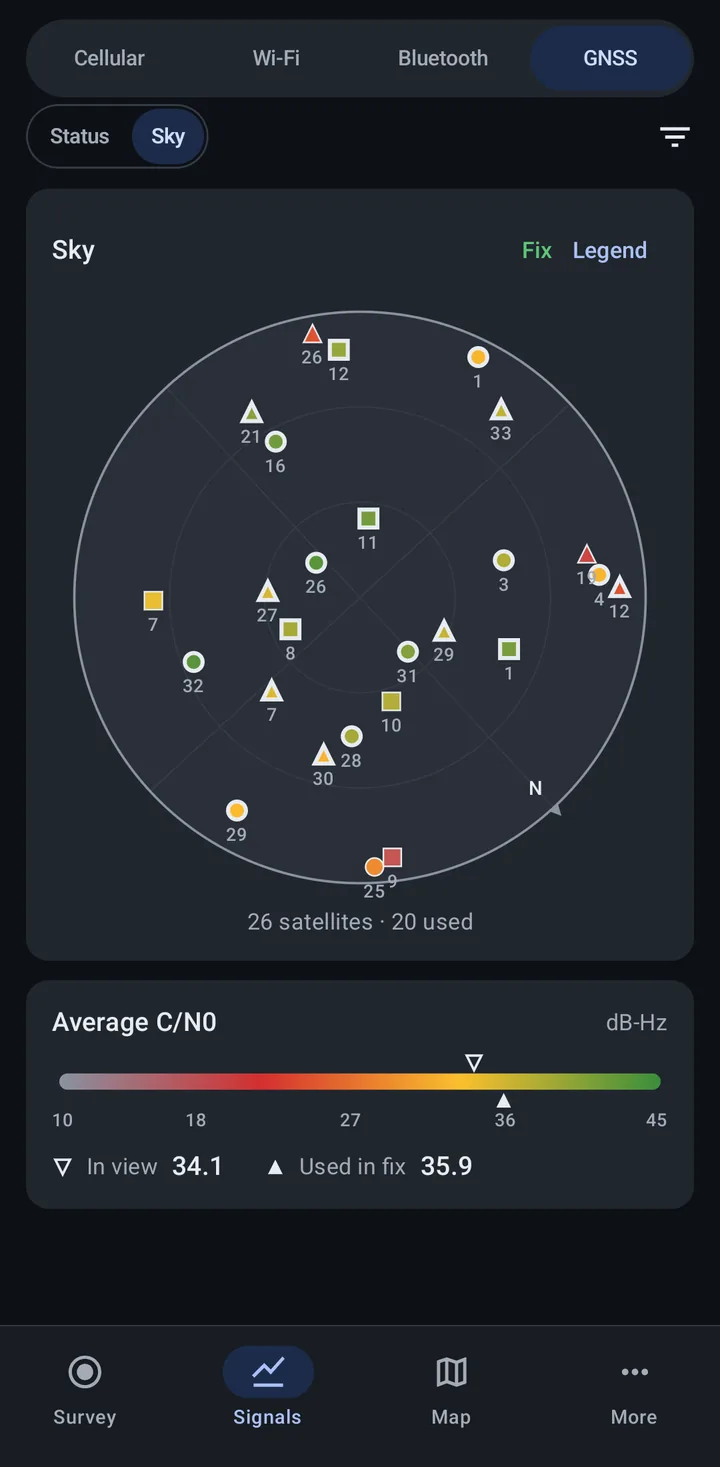
The sky plot shows where each satellite is: the center is straight up and the edge is the horizon. The plot turns with the phone, so up is the way the phone points, and N marks north. Under the plot is the number of satellites and how many are used in the fix.
Tap Legend for what the marks mean: the shape and flag of each satellite system and SBAS, how a satellite that is in view or used in the fix is drawn, and the color scale for signal strength (C/N0).
The Average C/N0 panel shows the average signal of satellites In view and those Used in fix on a scale in dB-Hz.
Credits
Section titled “Credits”The GNSS view is adapted from the open source GPSTest app. See More > Acknowledgments.
Related
Section titled “Related”- Network technologies overview: the Signals tab
- Location provider: the location source for survey records
- Required permissions: location permission details
- Scan rates: the GNSS scan interval